Educational Outcomes:
All weather and climate begins with the sun. Solar radiation is the only significant source of energy that determines conditions at and above the Earth's surface. The Earth receives about one two-billionth of the Sun's radiant energy production.
The average rate at which solar radiation reaches the earth at the top of the atmosphere and falls on a flat surface perpendicular to the sun's rays is about 2 calories per square centimeter per minute. This rate is known as the solar constant.
However, the amount of solar radiation that actually reaches the earth's surface can be quite different. The nearly spherical Earth, rotating once a day on an axis inclined to the plane of the orbit, presents a constantly changing face to the sun. Wherever there is daylight, the path of the sun through the local sky changes through the course of a year. Everywhere on Earth, except at the equator, the number of hours of daylight also changes through the year. In addition, the atmosphere reflects, absorbs, and scatters the solar radiation passing through it. Clouds, especially, can block much of the incoming radiation.
The purpose of this concept/process exercise is to investigate the variability of sunlight received the Earth's surface at different latitudes over a period of a year.
After completing this activity, you should be able to:
Before you begin this exercise, you should read the assigned pages in
the textbook on the earth-sun relationships and the seasons. You
will also need the following images which may be downloaded and printed:
|
(print in landscape) |
(print in landscape) |
(print in landscape) |
(print in landscape) |
(print in landscape) |
|
|
|
Investigations:
Before you begin this section, download and print the answer sheet. Unless told otherwise, put all your answers on the answer sheet. Each blank is worth one-half point.
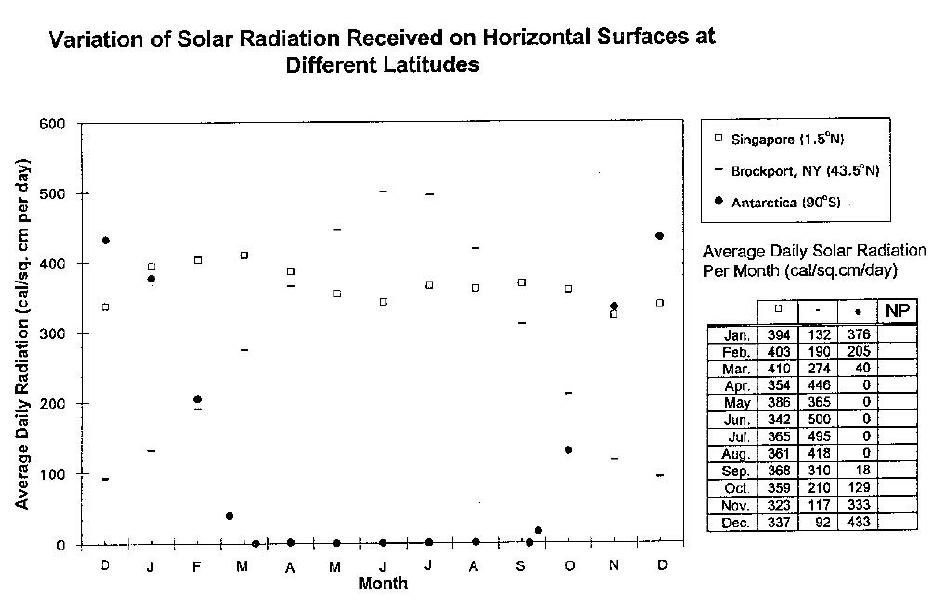
1) Download, print and examine the Image 1 graph entitled "Variation of Solar Radiation Received on Horizontal Surfaces at Different Latitudes." Data points plotted on the graph represent monthly averages of measurements of actual solar radiation received daily on a horizontal plane at the Earth's surface at near equatorial (Singapore, 1.5oN), midlatitude (Brockport, NY, 43.5oN; Youngstown is at a latitude of approximately 41oN), and polar (Antarctica) locations. These values were determined from actual observations and include the effects of clouds. Time (month of year) is plotted along the horizontal axis and average daily incident radiant energy in calories per square centimeter per day is plotted vertically.
2) Construct an annual radiation curve for each of the three locations. Do this by drawing a smooth curved line connected the radiation values plotted for each location. Note that at the South Pole (90oS) the sun rises on or about September 23 and sets on or about March 21. Draw each curve to the edges of the graph. December values are plotted twice to more clearly illustrate the annually repeating radiation cycles.
3) According to the curves you have drawn, at which latitude shown does average daily solar radiation vary the least over the period of a year? [ A) Equatorial (Singapore, 1.5oN) B) Midlatitude (Brockport, NY, 43.5oN C) Polar (Antarctica, 90oS) ]
4) The pattern of sunlight received at the equator over the course of a year indicates that the seasonal contrast there is [ A) similar to B) different from ] the seasonal contrast experienced in midlatitudes.
5) The graph shows that there is a six-month period during which there is no sunlight at the [ A) equatorial B) midlatitude C) polar ] location.
6) According to the graph, there are months when both the midlatitude and polar locations receive more solar radiation than the equator. For both midlatitude and polar locations, the major factor that causes this difference is the greater [ A) local noon-day sun angle B) length of daylight ].
7) Comparison of the three annual radiation curves indicates that the annual range (difference between maxima and minima) of solar radiation received daily [ A) increases B) decreases ] as latitude increases.
8) Mark the equinoxes and solstices on the graph by drawing vertical lines at approximately March 21, June 22, September 23, and December 22 and then label them. (1 pt.) (Note that the letter designating the month is mid-way between the boundaries of that month.) Next, label the intervals between the lines as the Northern Hemisphere's winter, spring, summer, and fall seasons. (1 pt.) On the equinoxes the noon sun is directly above the equator, whereas on the solstices the noon sun is directly above 23.5oN or S latitude. When the noon sun is directly overhead at a particular location, the sun's angle is [ A) 10o B) 45o C) 90o ].
9) Two maxima and two minima appear in the annual solar radiation curve for the equatorial location. Maxima occur near the [ A) solstices B) equinoxes ].
10) The area enclosed under the curve in each of the seasonal segments is directly proportional to the total solar radiation received during that season. According to the "seasonal" areas under each curve, all seasons at the [ A) equatorial B) midlatitude C) polar ] location receive about the same amount of solar radiation.
11) Based on the graph in Image 1, at the mid-latitude location, the seasons of _________ & _________ receive the most solar radiation whereas the seasons of __________ & __________ receive the least.
12) During the Northern Hemisphere's spring and summer, the South Pole receives [ A) its maximum B) zero ] solar radiation. In the Southern Hemisphere, these are the seasons of ___________________ and ___________________.
13) Examine Images 2, 3, and 4 which are visible satellite images. These are actual images which were obtained on or near the first days of the Northern Hemisphere's fall, winter, and summer seasons. Next, examine the small drawing to the right of each earth image. The drawing shows the relative positions of the Earth, satellite, and rays of sunlight at the time each image was recorded. (In the small drawing, the view is from above the earth's Northern Hemisphere.) If you were located on the satellite, you would have seen the same view of the earth as shown in each accompanying satellite image.
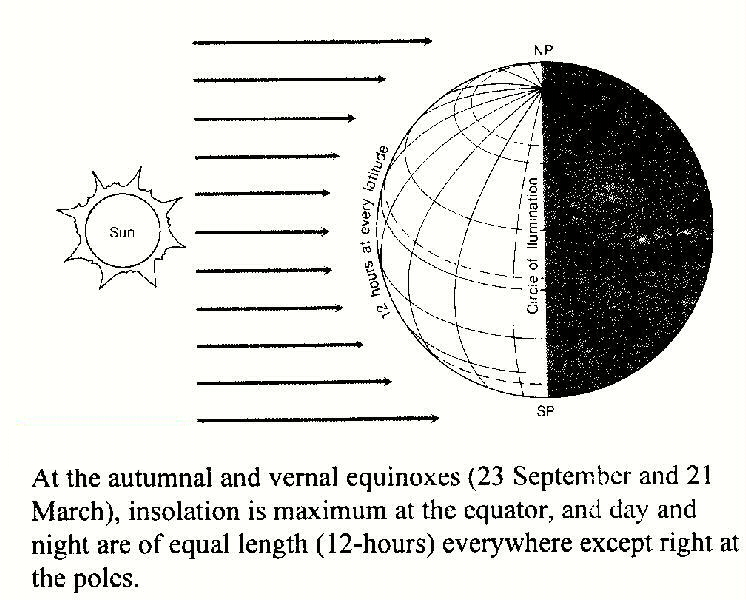
Compare the 23 September satellite image (Image 2) with Image 5, a figure showing autumnal and vernal equinox Earth/Sun relationships. Note that in both, the sunset line and the Earth's axis line up together and are oriented perpendicular to the sun's rays. Consequently, the period of daylight is ________________ hours everywhere except right at the poles.
15) Compare the 21 June satellite image (Image 4) with Image 7, a figure showing the Northern Hemisphere's summer solstice. On the Northern Hemisphere's summer solstice, the Earth's North Pole is titled towards the sun as far as it ever gets during the year. Consequently, poleward (north) of the Arctic Circle, the period of daylight is ___________ hours. Poleward (south) of the Antarctic Circle, the period of daylight is ___________hours.
After downloading and printing, please put your answers on the answer
sheet. With the answer sheet on top, staple your completed
Figure 1 to the answer sheet as page 2. Late exercises will
NOT
be accepted.
1 Oct 03